The Company

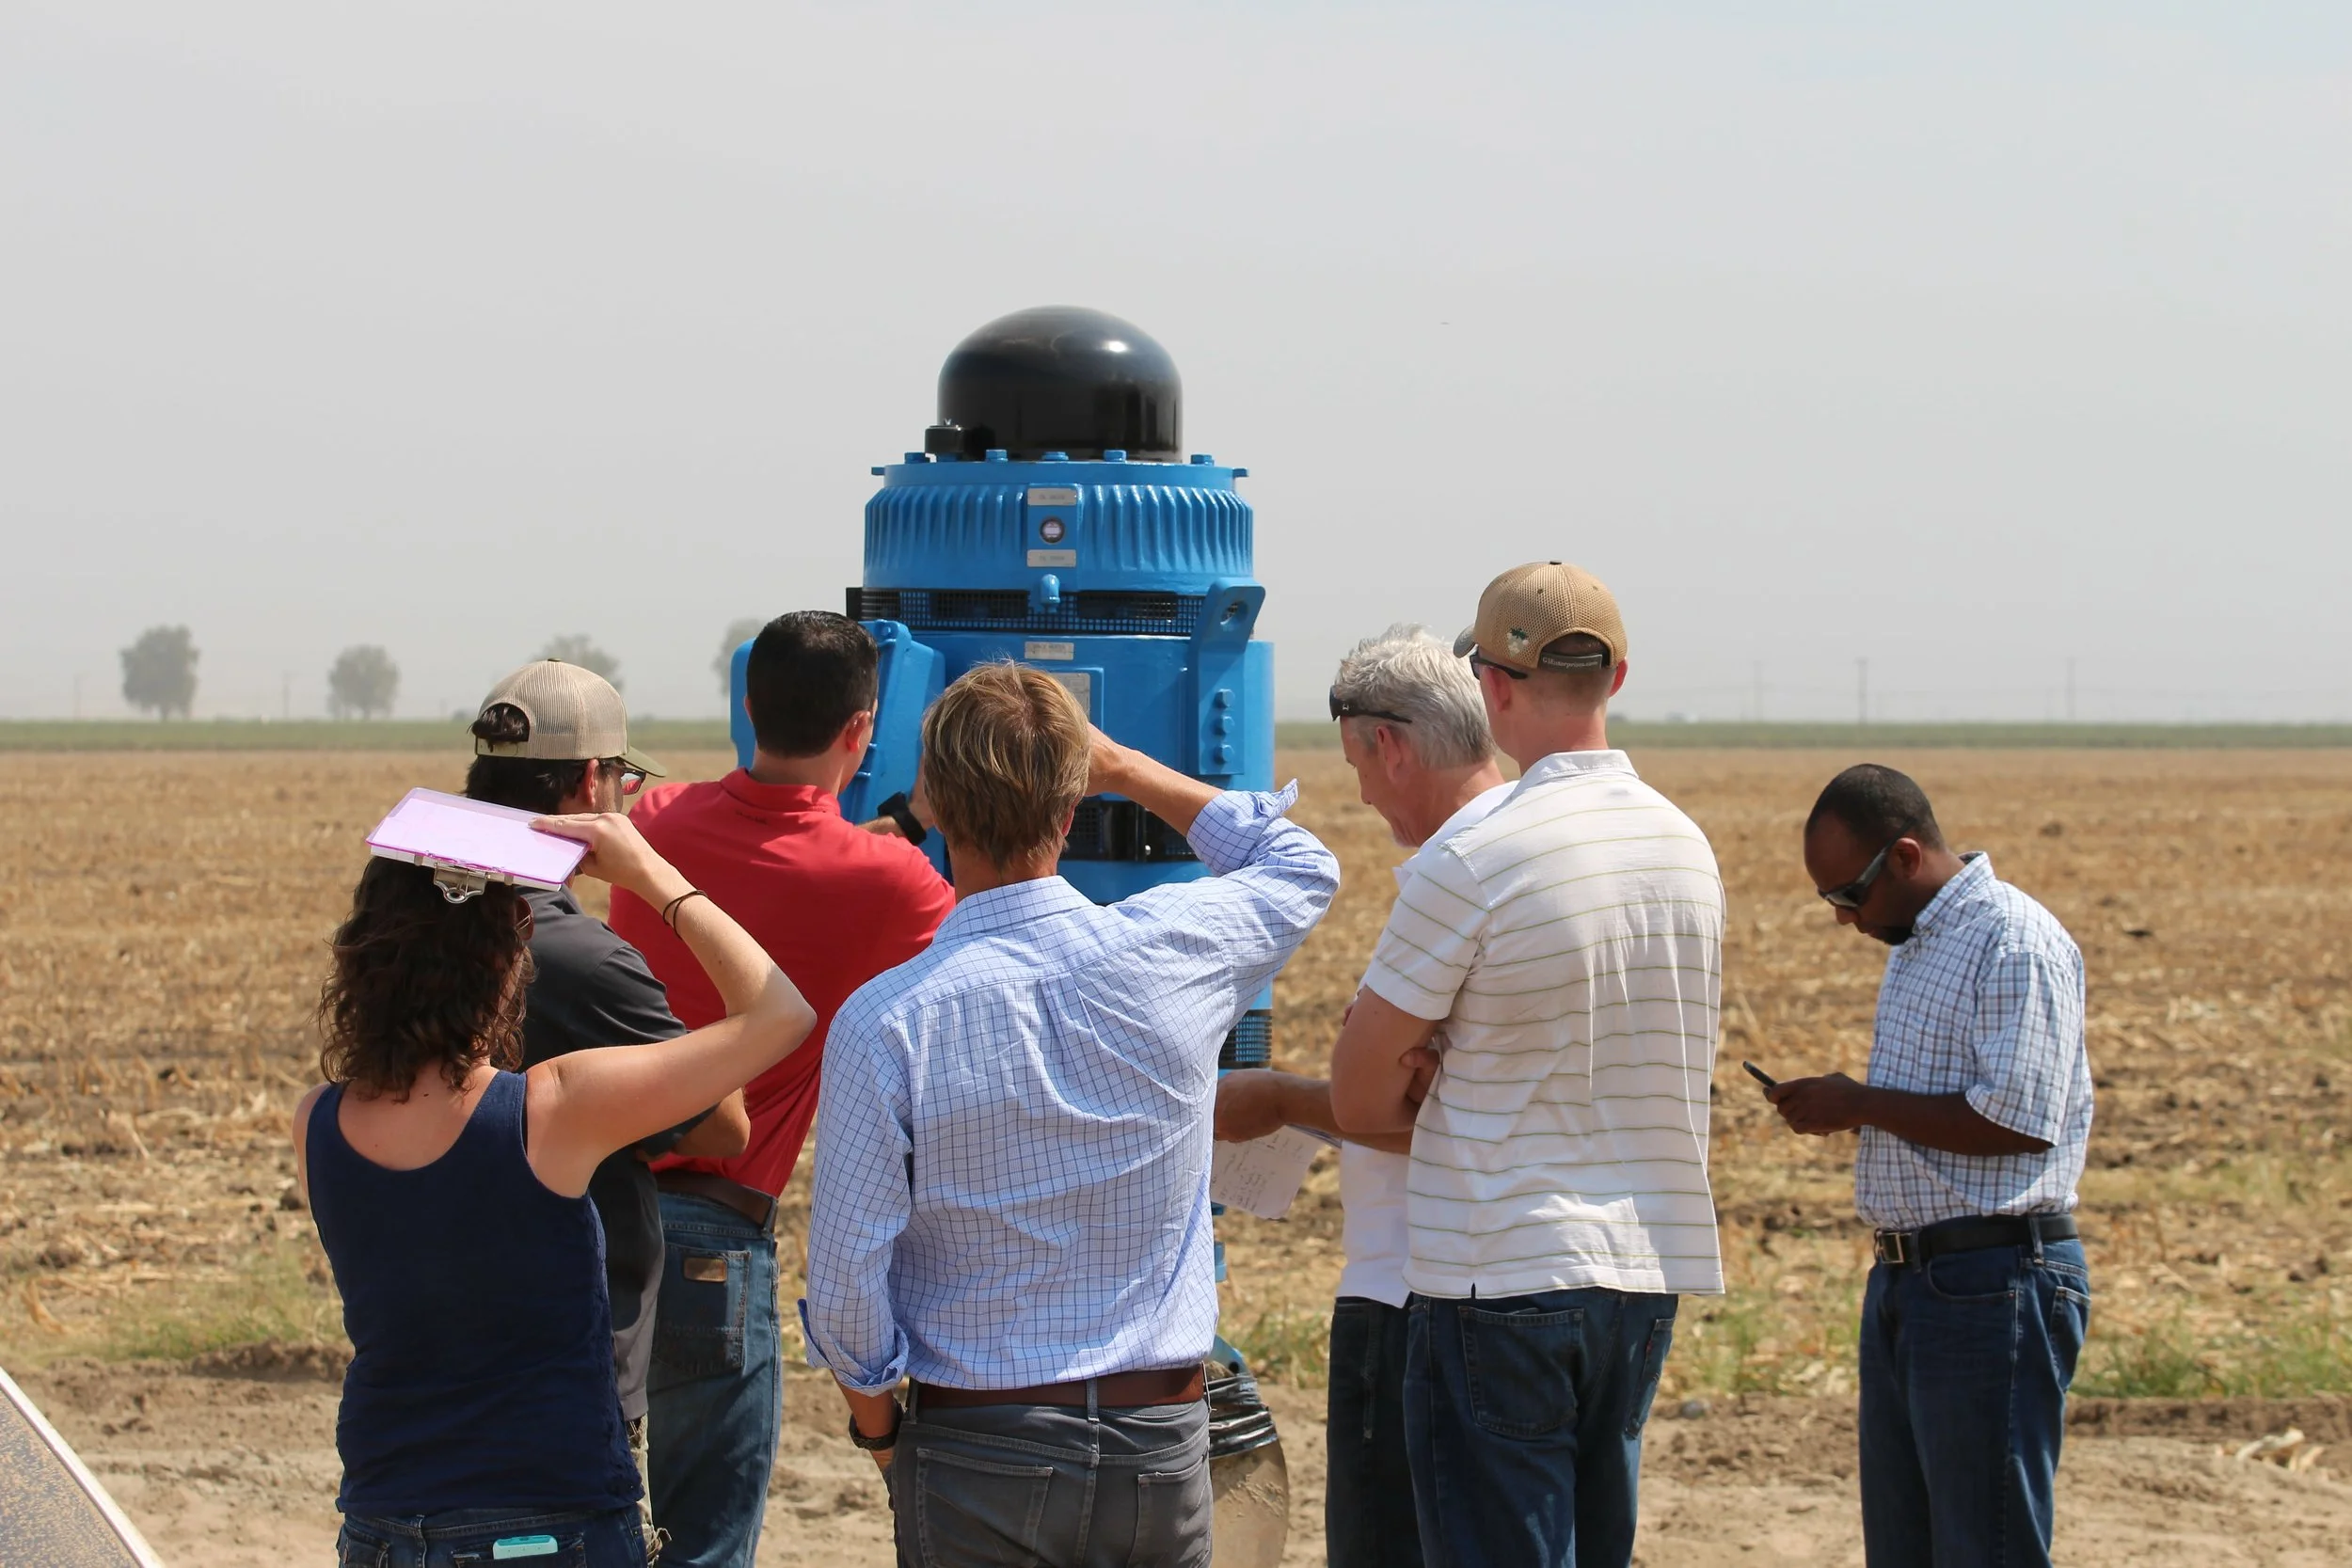
Wexus is an AgTech company that builds SAAS software to help farmers manage their energy, water and other natural resources. Their goal is to help growers save money, time, energy, and water.

My Role

User Research, Personas, User Interviews, User Journey, Information Architecture, User App Flow, Wireframes, Prototyping, & User Testing.

dashboard responsive.png

The Problem

The third largest operating expense for farmers is energy and roughly 90% of that energy is used to pump water out of the ground to water crops. Managing that energy is complex, time intensive and expensive.

The Solution

I designed a dynamic SAAS platform to manage energy and water usage as well as billing information in near real time accuracy.

Before building anything, I went through a rigorous process of user research starting with surveys and interviews to determine precisely who at a farm would be using the Wexus product and what the problems and needs to of the customer were. With this research done, I created four key user personas and wrote stories about their challenges . These stories were used as the foundation to map out underlying architecture of the Wexus software platform.

Generl Manager George Circle.png

General Manager

Responsible for general decision-making at the farm level, planning, verifying & overseeing profit & loss including operational costs for all ranches.

Goals: Reduce operational costs. Meet production targets. Meet regulatory requirements for reporting energy and water usage.

Ranach Manger Ralph Circle.png

Ranch Manager

Ranch managers need to make decisions quickly based on factors outside his control incl. weather, other crop irrigation (on shared or leased lots).

Goals: Reduce Energy, Water, and Labor costs. Improve crop yield in areas under management.

Accountant Amy Circle.png

Accountant

Receives bills from local utility on a continuous basis & spends hours manually inputting data into an Excel spreadsheet.

Goals: Needs easy access to data in an exportable format. Wants year-year comparisons & utility data breakdown (gas, electric, water).

Sustainability Manager Persona circle.png

Sustainability Manager

Research, analyze and propose solutions to use energy resources more efficiently. Track and report monthly & yearly progress against sustainability targets/ metrics.

Goals: Meet or exceed sustainability goals. Get buy-in from other stakeholders to move forward with projects.

INFORMATION ARCHITECTURE

Given the complexity of working with energy and water. I started by creating a list of every story for each persona that the platform would need to solve for and then investigated solutions for each story. I then mapped each solution to determine the most intuitive architecture for the platform.

info arch.jpg

DASHBOARD

Upon logging in the first page a customer sees is a dashboard displaying how much electricity and water is used on the farms as well as how much it cost to use that energy. Below those three chars is a further breakdown of energy use so the viewer may compare the cost of energy and water use by ranch on the farm and a breakdown of how energy is used by various types of equipment.

Background Farm Dashboard Alert Icon.png

COMPARE YEARS

By toggling a button the user can switch views and see a year over year comparison of spend, energy and water consumption.

CHange views

The customer can alternate which of the three top charts on that page is the largest with a click of a button.

Dashborad Navigation

The dashboard charts can be filtered to show entire the farm, a specific ranch or a specific piece of equipment.

ALERTS

At the top right side of the platform in an alert icon. When it is clicked, a menu of alerts slide in detailing alerts concerning, drops in pump efficiency, upcoming bill payments, blackouts and more. The icon next to the alert indicates the type of the alert as well as the priority level. When the individual alert is clicked on the user is taken to a page where they can get more info or take action.

DOWNLOAD DATA

On the right side of the secondary navigation menu is a download icon. When clicked, a menu slides in allowing the user to select what information they wish to download. They can download spreadsheets with spend and usage data for either granular analysis or upload into accounting software as well as their water use formatted to comply with government reports.

EQUIPMENT STATUS

The equipment status page allows users to quickly find pumps, solar arrays, cold storage units etc. by geo location. When a particular piece of equipment is located and selected a quick overview of the status and heath of the equipment is laid over the map.

RATE ANALYSIS

One of the easiest ways for a customer to save money on their energy bills is to change the rate their meter is billed with. On this page, the user can compare their current costs to costs under a different hypothetical rates including the Wexus recommended rate.

WAYS TO SAVE

The Wexus platform tracks both identified savings as well as actual savings allowing the user to track their progress on making their farm more sustainable. This page also shows personalized recommendations on how to realize some of the identified savings.


“I have had the privilege of working closely alongside Alyson for several years at Wexus. I've consistently witnessed her exceptional leadership and design talents shine through. She has a knack for maneuvering through complexities while shaping our product roadmap and fostering a cohesive team environment. Alyson's leadership has been pivotal in propelling the development of AI-powered software, significantly bolstering our technological offerings. I confidently recommend Alyson for roles that value innovation, dedication, and a sharp eye for user experience.”

Chris Vines, Co-Founder